This project showcases proficient data analysis and visualization skills in Power BI. It demonstrates expertise in tasks such as data preparation, relational modeling, and the application of DAX. The final result includes refined reports and dashboards, highlighting a nuanced grasp of best practices in data visualization within the Power BI platform.

About Project

SITUATION

AdventureWorks, a global manufacturing company specializing in cycling equipment, faced challenges tracking key performance indicators (KPIs) such as sales, revenue, profit, and returns. The raw data needed for analysis was available in CSV files, requiring transformation and modeling for effective business intelligence.

TASK

The task involved leveraging Power BI desktop to connect and transform the raw CSV data. I aimed to build a relational data model, implement calculated columns and measures using DAX, and ultimately design an interactive dashboard. The goal was to enable the management team to analyze performance across regions, identify high-value customers, and track product-level trends.

ACTION

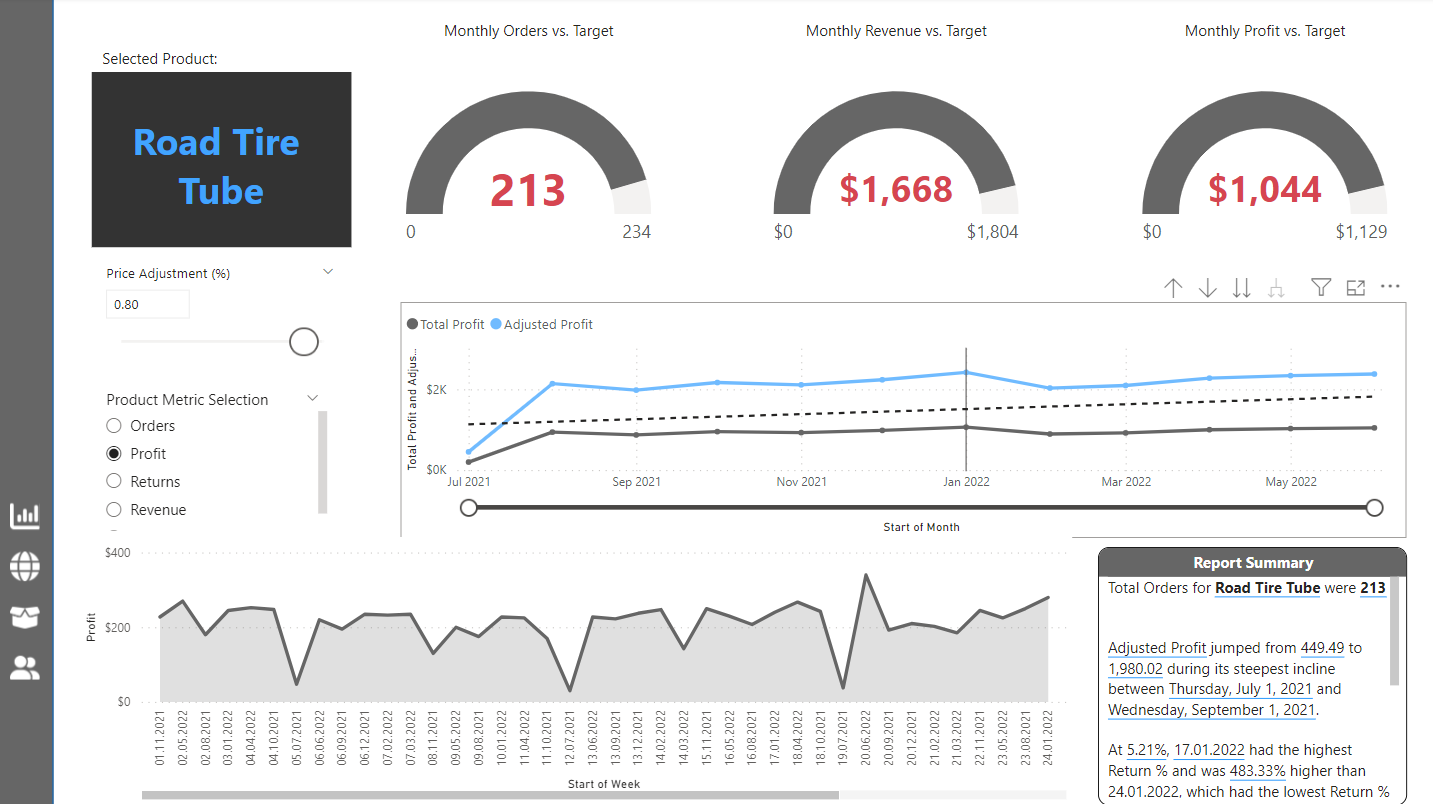
I initiated the project by creating a data pipeline in Power BI, transforming the raw CSV files into a cohesive relational data model. Using DAX, I established calculated columns and measures to capture essential KPIs. The interactive elements of Power BI, such as sliders, custom tooltips, and a personalized filter pane, were implemented to enhance user experience. Advanced features like parameters for what-if analysis and dynamic charts using field parameters were incorporated. Additionally, geospatial tools and customer-level views were integrated to provide a comprehensive analysis.

RESULT

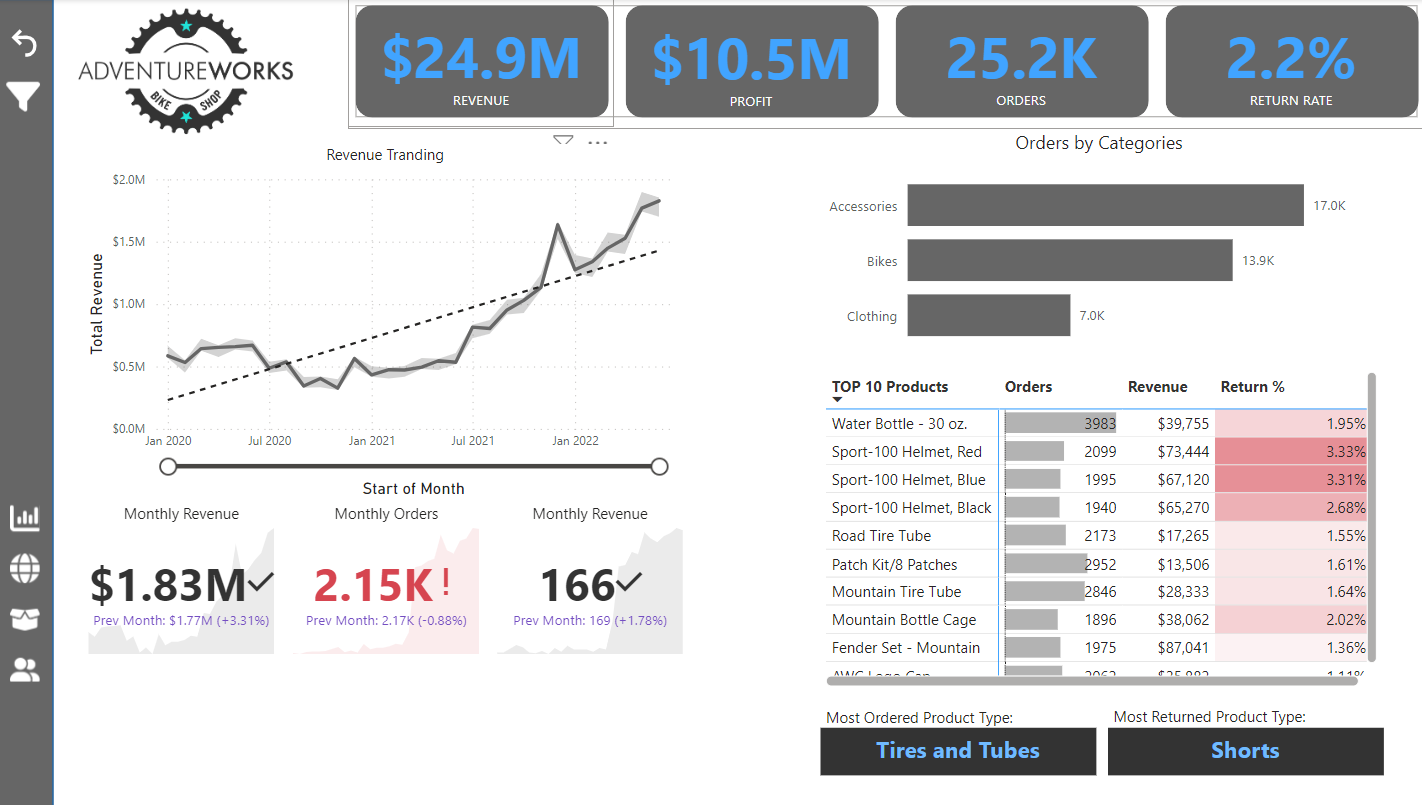
The final outcome was an interactive Power BI report tailored to AdventureWorks' needs. The executive summary view showcased crucial KPIs with a weekly revenue trending chart. The drill-down capabilities allowed detailed analysis at the product and customer levels. The project not only provided actionable insights for decision-makers but also enhanced the overall data visualization experience. As a result, AdventureWorks gained a powerful tool to track and optimize their business performance.

Built With

Power BI

Data Preparation with Power Query

Using Power Query to establish connections and format data, investigating standard connectors, storage modes, and profiling tools, and incorporating table transformations to optimize data structuring.

Relational Data Modeling

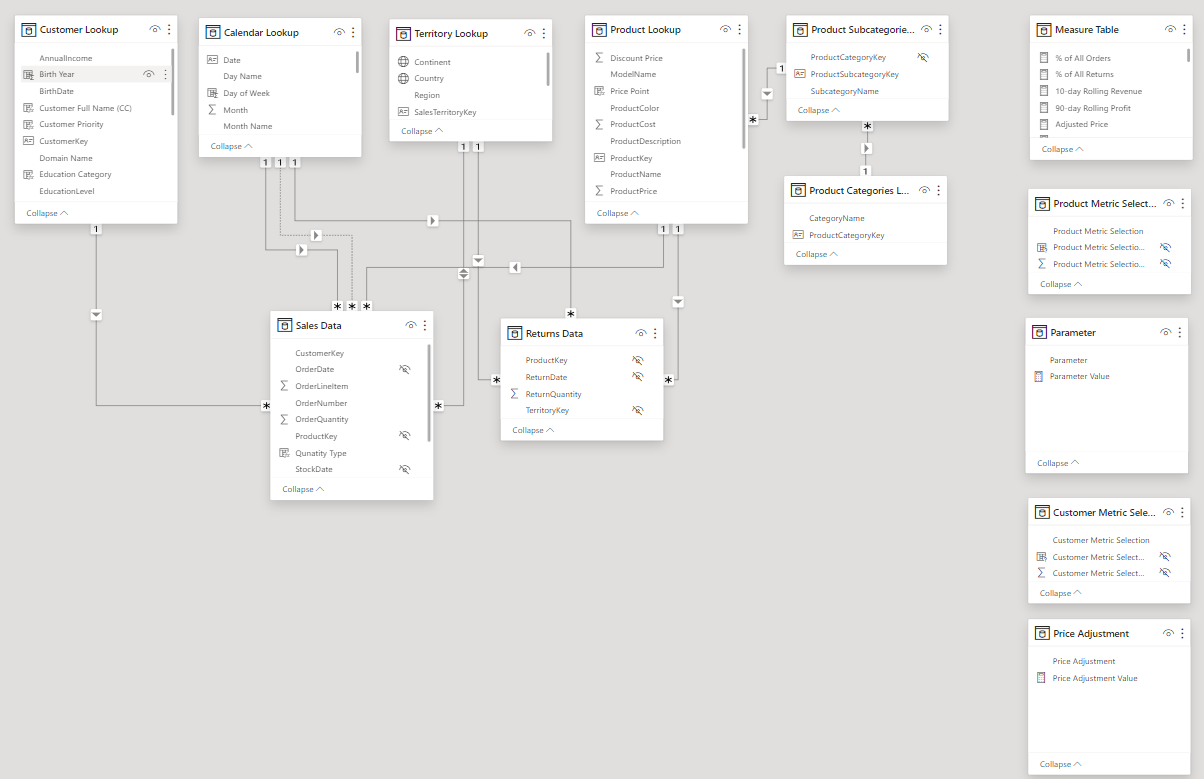
Delving into key concepts such as cardinality, normalization, and filter flow, we explore the intricacies of database design. Constructing a resilient Adventure Works model from the foundation, with a focus on promoting star schemas for optimal structure.

Report and Dashboard Development

Applying visualization best practices for the creation of professional-quality reports, building and formatting basic charts, exploring AI visuals for enhanced insights, and adding interactivity with features like bookmarks, slicer panels, parameters, custom tooltips, and report navigation.

DAX (Data Analysis Expressions)

Creating calculated columns and measures using DAX involves understanding DAX concepts such as row and filter context, formula syntax, and the application of filter functions, iterators, and time intelligence patterns.

Optimization Tools

Previewing native and external optimization tools in Power BI, exploring the performance analyzer and optimization presets for efficient report development.
Documentation