Our bank aimed to enhance monitoring and assessment of lending activities, necessitating the creation of a comprehensive Bank Loan Report. The goal was to derive insights into key loan metrics, track changes over time, and enable data-driven decision-making to optimize lending strategies.
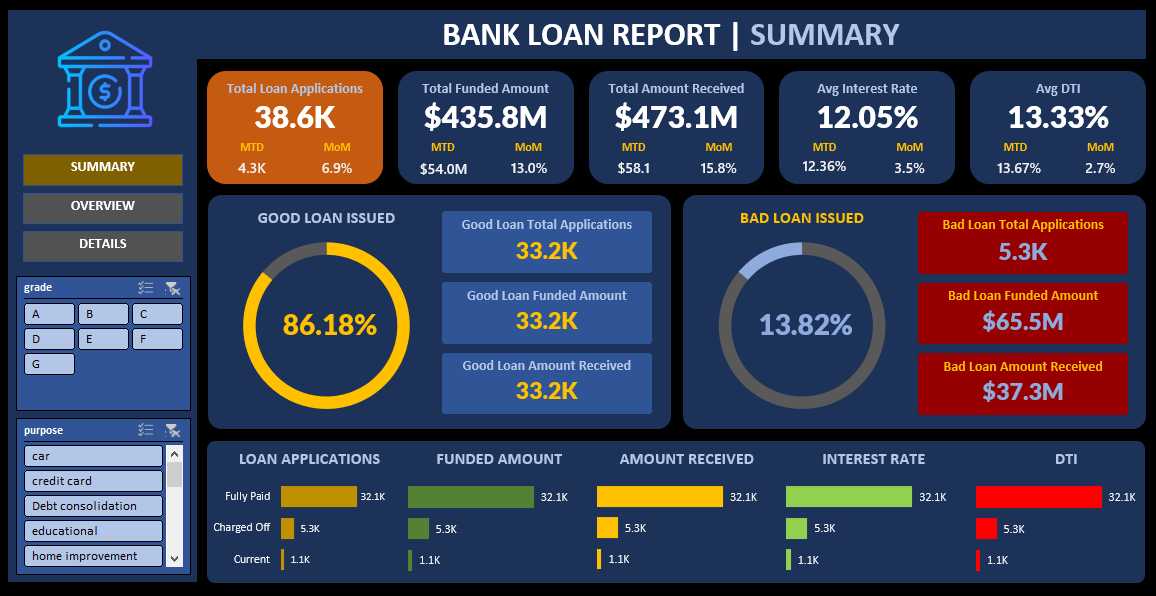
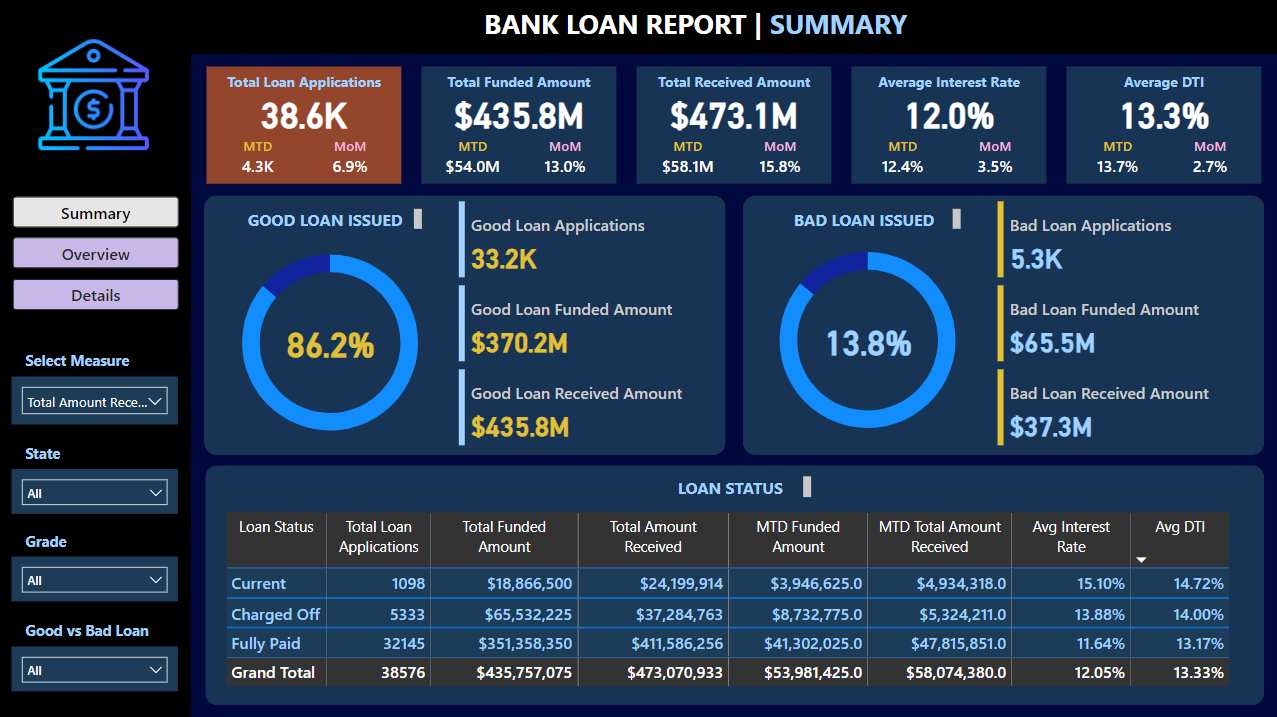
The challenge involved developing a Bank Loan Report with three distinct dashboards: 'Summary,' 'Overview,' and 'Details.' The 'Summary' dashboard required tracking KPIs such as total loan applications, funded amounts, amounts received, average interest rates, and average debt-to-income ratios.
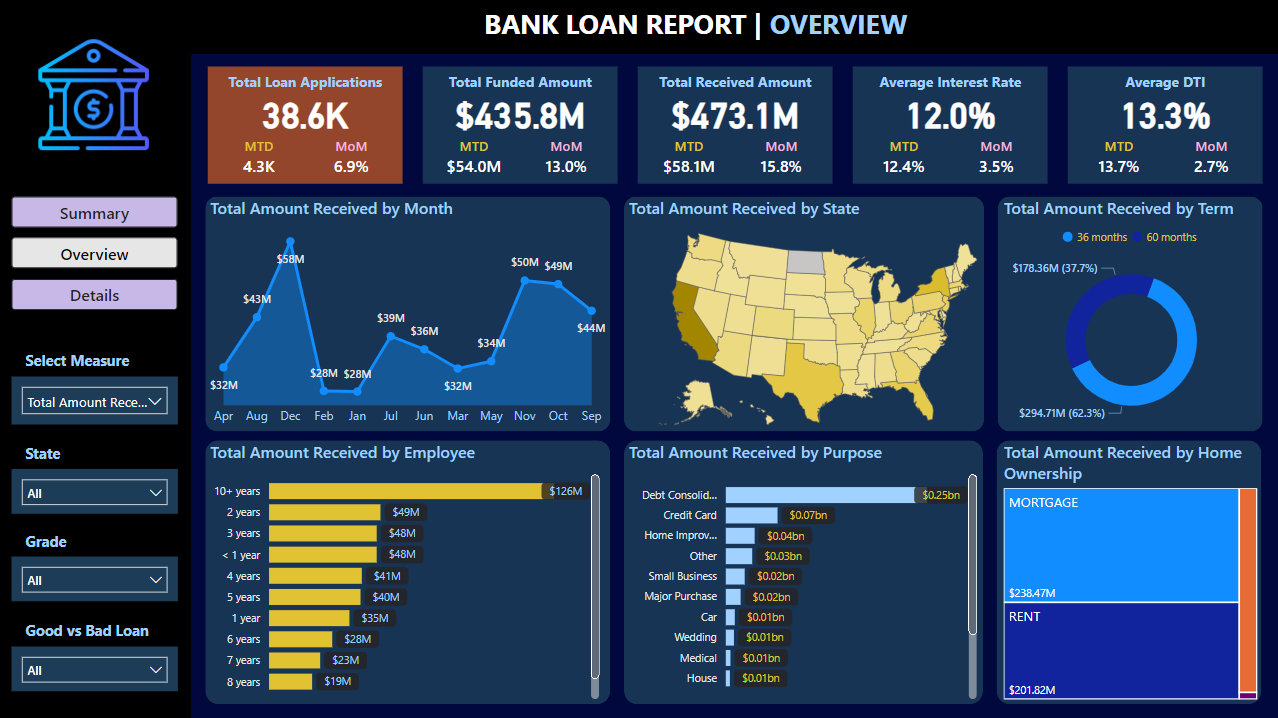
For the 'Overview' dashboard, our aim was to visually represent critical loan-related metrics and trends. Each chart type within the 'Overview' dashboard had specific objectives, such as identifying seasonality, assessing regional disparities, understanding loan distribution by term lengths, evaluating the impact of employment history on applications, breaking down loan metrics by purpose, and displaying hierarchical information on home ownership impact.
The 'Details' dashboard, part of this expanded scope, provided a consolidated view of essential information within our loan data. It aimed to offer a holistic snapshot of key loan-related metrics and data points, providing a user-friendly interface for accessing vital loan data. This dashboard served as a comprehensive, one-stop solution for users seeking detailed insights into our loan portfolio, borrower profiles, and loan performance.
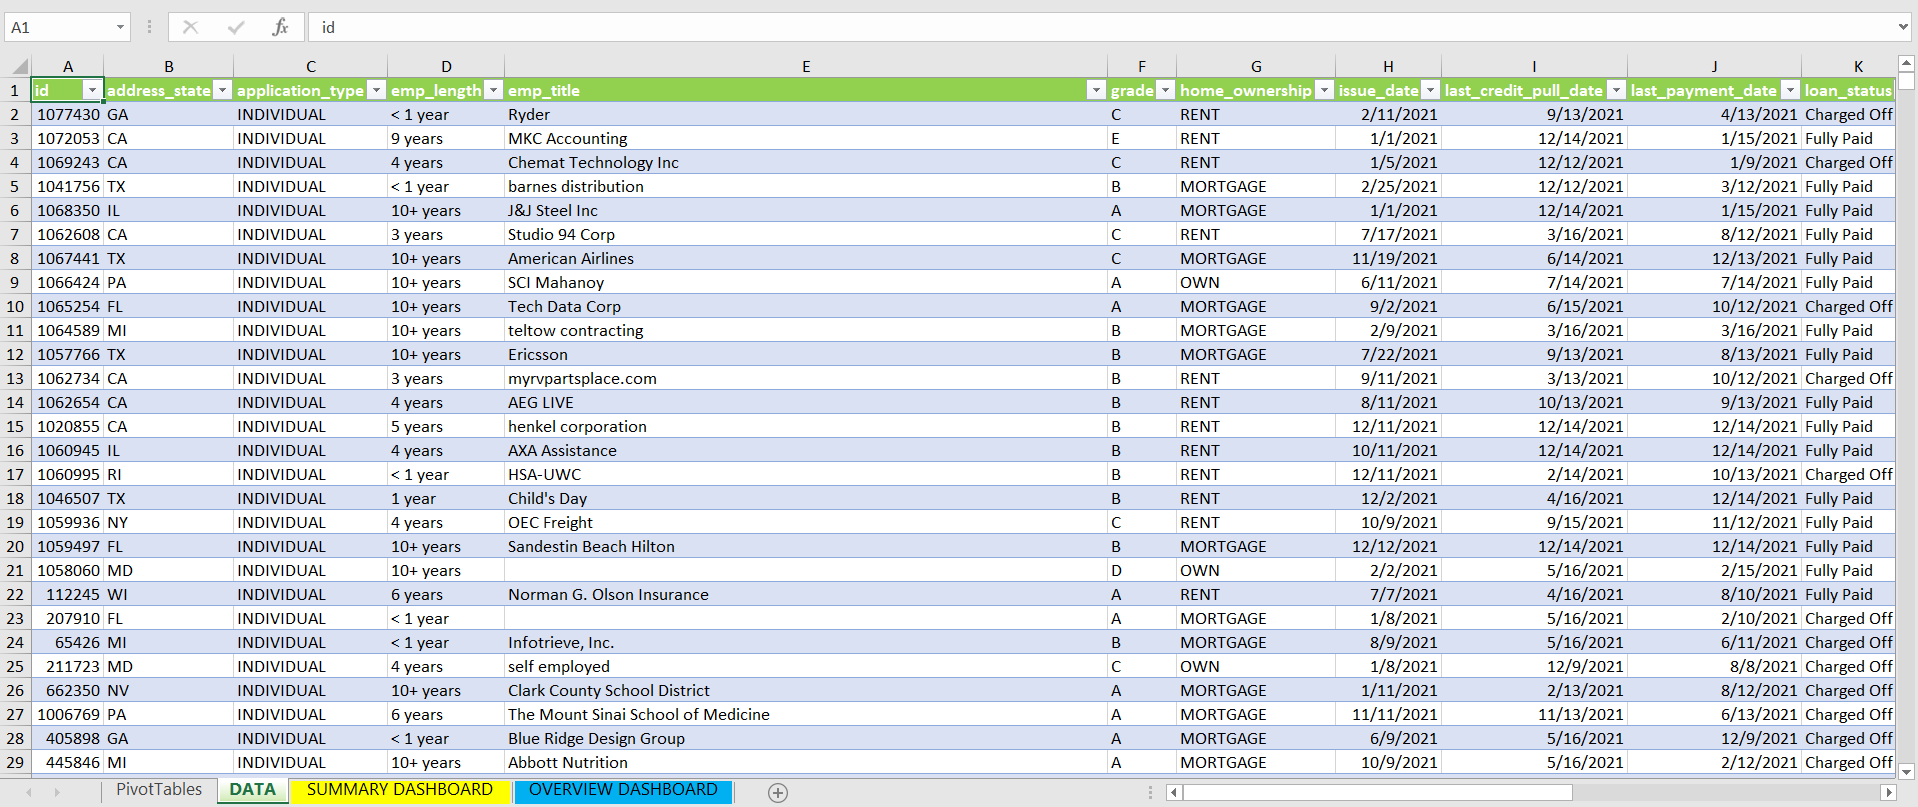
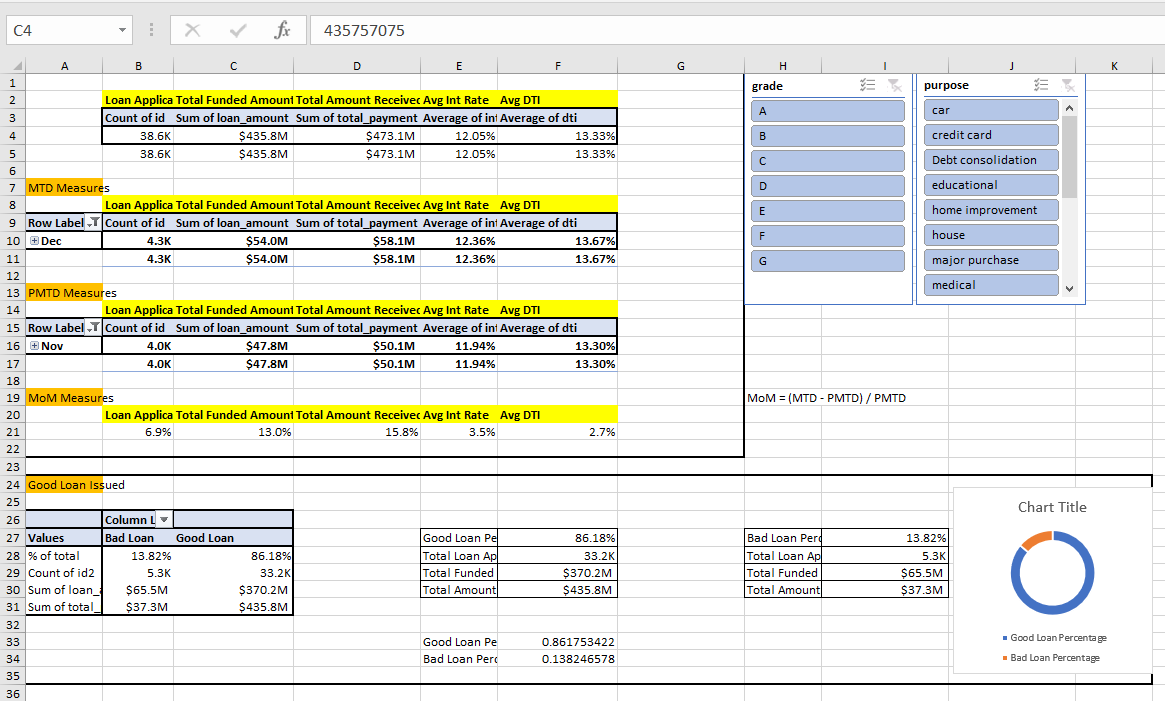
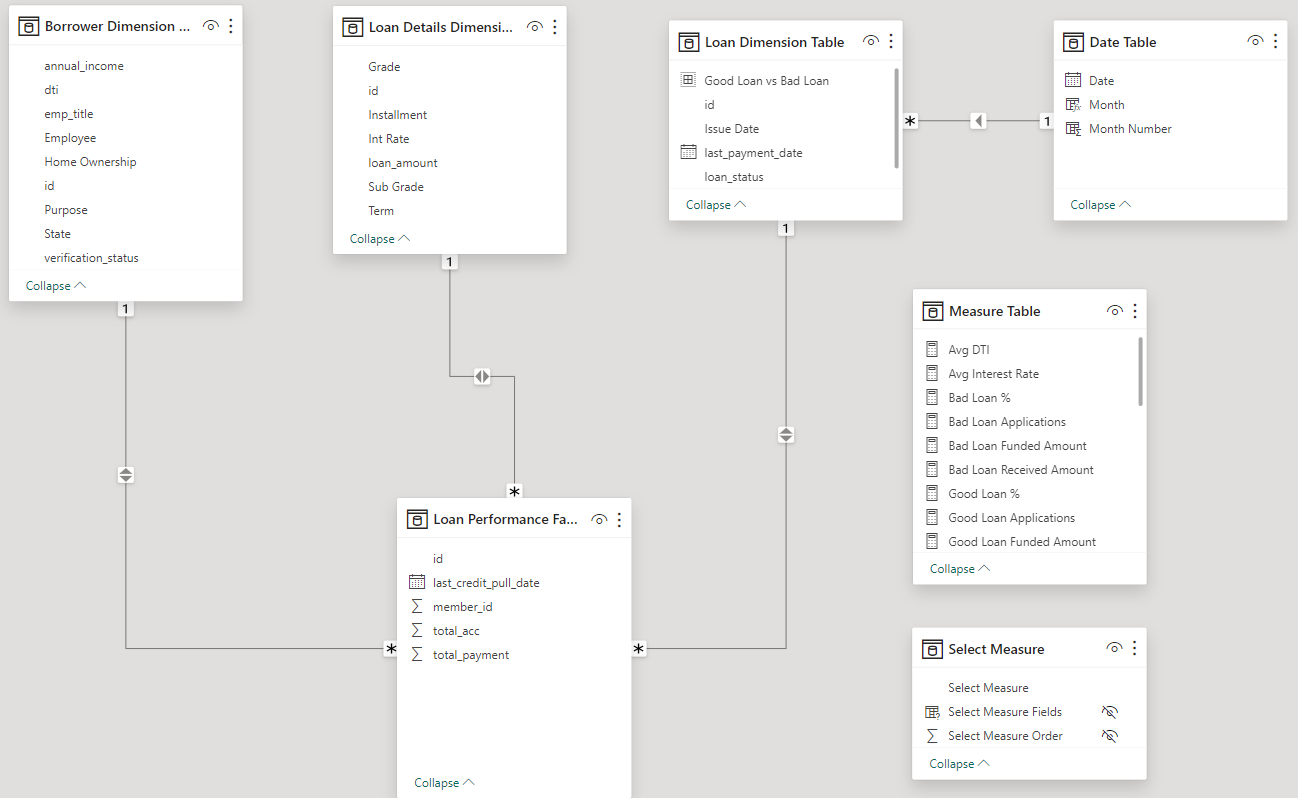
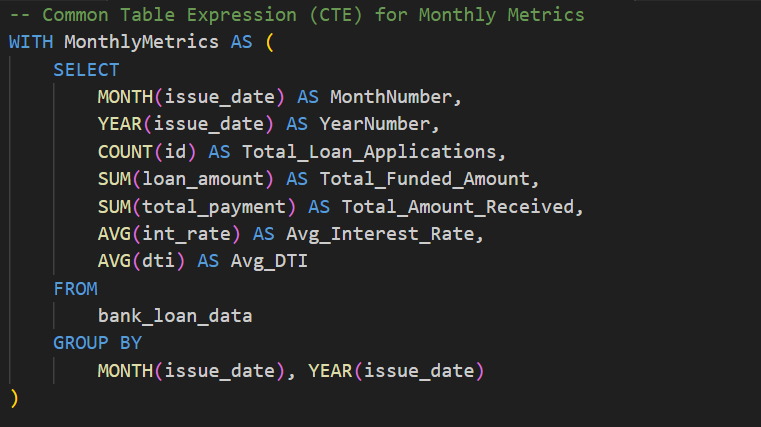
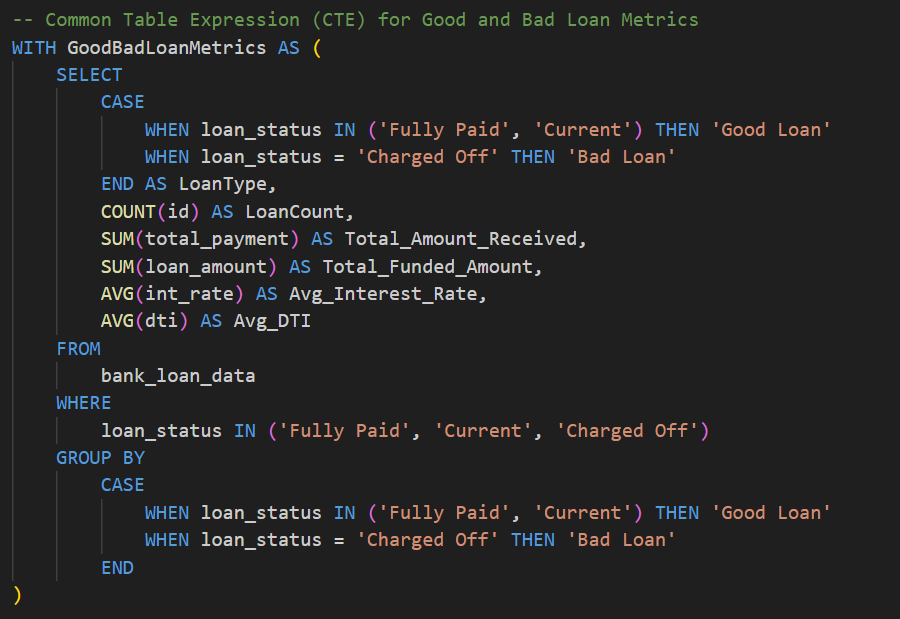
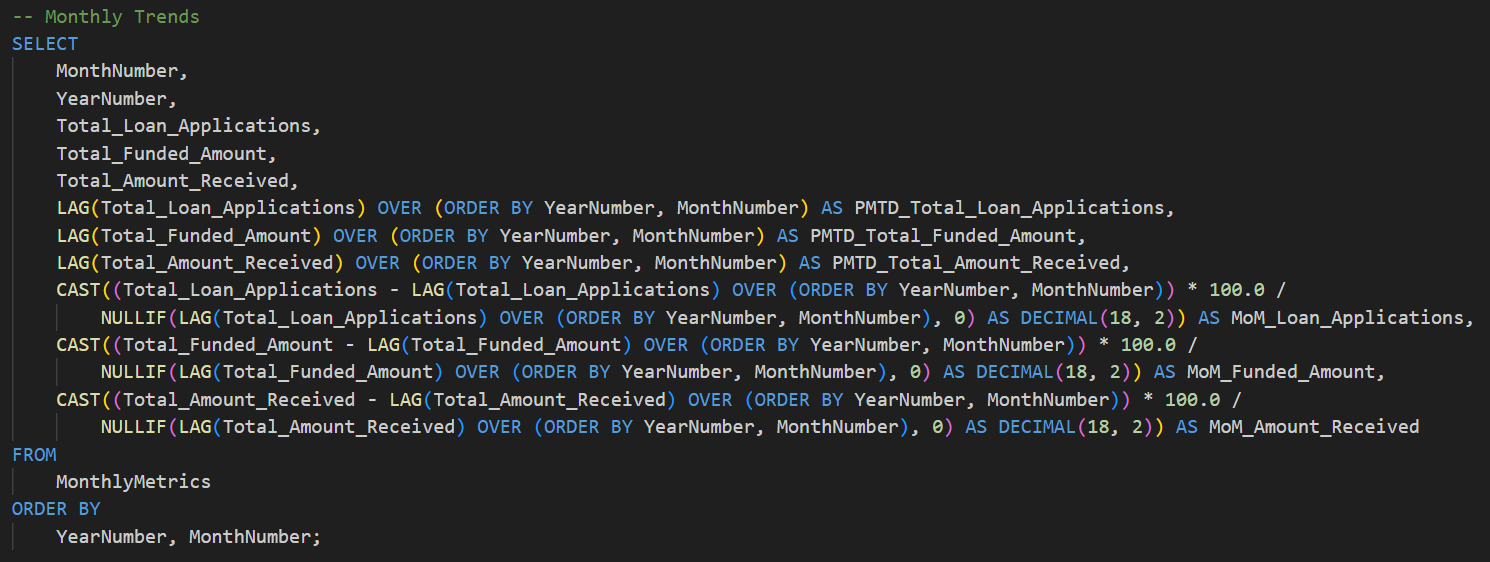
To address this extended scope, a robust data pipeline using Excel, Power BI, and SQL was designed and implemented. Excel facilitated initial data cleaning, Power BI handled visualization, and SQL managed advanced data manipulation. The process involved creating calculated columns, aggregating data, and designing a complex data model to facilitate dynamic reporting. The dashboards were then crafted in Power BI, integrating diverse visualizations to present the KPIs effectively and distinguish between good and bad loans.
The Bank Loan Report project yielded a comprehensive set of dashboards that empowered our bank with a holistic view of lending operations. The executive-level 'Summary' dashboard provided quick insights into key metrics, aiding in strategic decision-making by offering a nuanced evaluation of lending quality, contributing to improved portfolio management and informed lending strategies. The 'Overview' dashboard enhanced our ability to visualize and communicate loan-related insights effectively, supporting data-driven decisions. Simultaneously, the 'Details' dashboard provided a user-friendly interface for accessing vital loan data, offering a holistic snapshot of key loan-related metrics and data points. Overall, the project significantly enhanced our ability to assess the health of the loan portfolio and make judicious, data-driven decisions.
