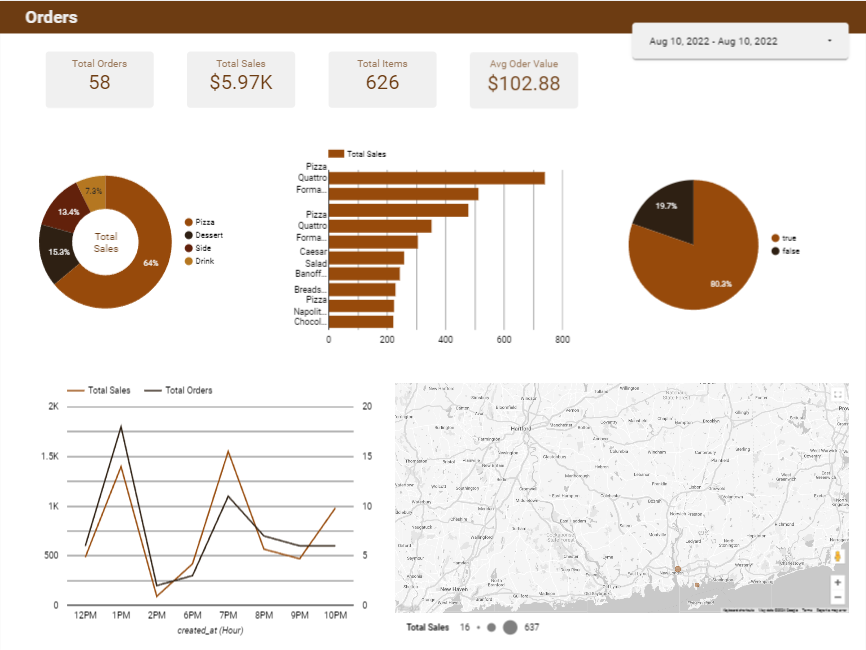
The project involves creating a tailor-made relational database for a new pizzeria. The project utilizes tools such as Excel for data organization, Quick Database Diagrams for database design, and SQL for creating and managing the database. Additionally, Looker Studio is used for data visualization and is integrated with Google Cloud Console for secure and scalable data storage and processing.

About Project

SITUATION

Ben is opening a new pizzeria in his town, focusing on take-out and delivery services similar to Domino's. He has provided a project brief to design and build a tailor-made relational database for his business, which will capture and store essential information related to customer orders, stock levels, and staff management. The database will enable him to monitor business performance and will be used to create interactive dashboards for this purpose.

TASK

The first part of the project involves designing and building an orders table for the database. This table needs to include columns for item name, item category, item size, item price, quantity, customer first name, customer last name, delivery address, and other relevant details. The task also includes normalizing the data, adding related tables, and defining table relationships to ensure data efficiency and flexibility.

ACTION

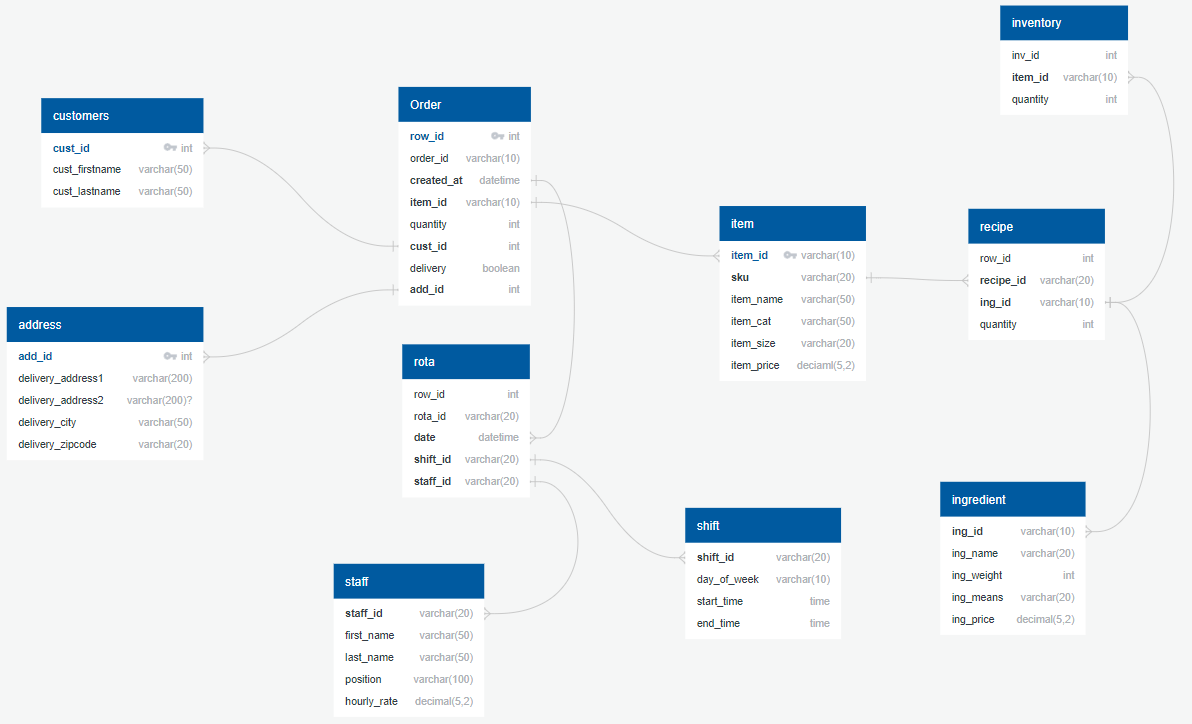
The project involves creating separate tables for customers, orders, address, item, recipe, ingredient, inventory, rota, shift, and staff. Each table is given a unique ID and then connected to one another via this key. The database is then exported for use in MySQL. The project also includes creating a dashboard for the database, which will be used to monitor and evaluate the performance of the pizzeria.

RESULT

The completion of this project will provide Ben with a comprehensive database that effectively handles customer orders, ensures optimal stock management, and facilitates efficient staff management. The interactive dashboards created from this database will enable Ben to monitor and evaluate the performance of his business, providing valuable insights for decision-making.

Built With

Normalization

The project used normalization techniques in Excel to improve data integrity and minim This involved creating mock-ups of tables and organizing the data systematically before importing it into the database.

Database Design Tools

The project uses QuickDBD, a database design tool, to create a visual representation of the database schema. QuickDBD allows the user to specify tables and their fields, and then produces a diagram of the database and its tables.

SQL Queries

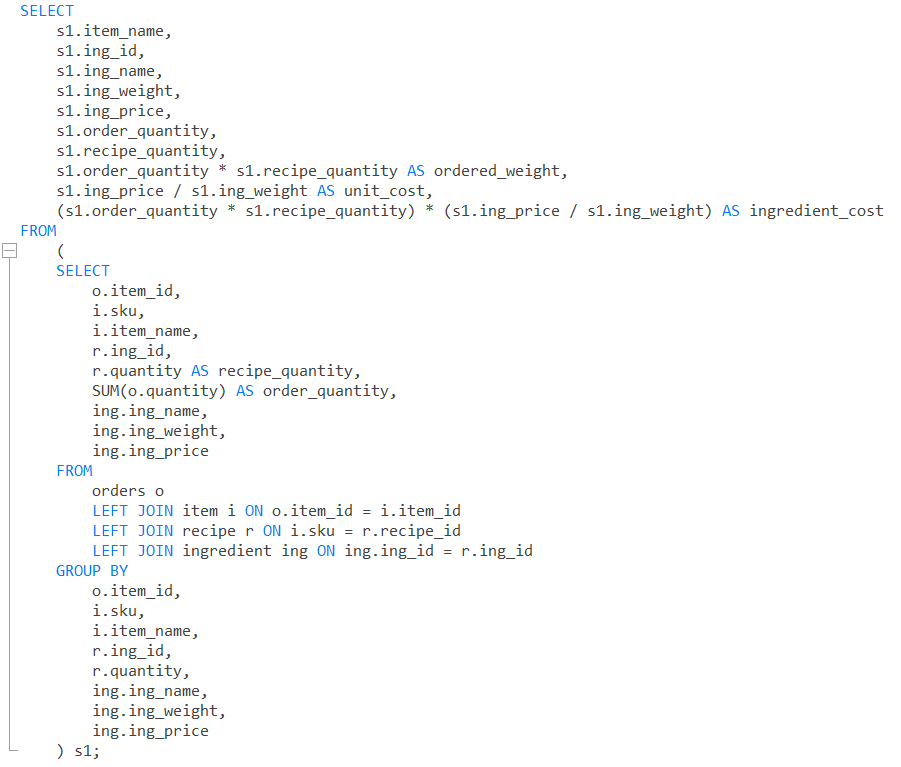
The project involves writing custom SQL queries to extract data from the database execute in MySQL using NaviCat. SQL queries are used to retrieve data from the database, filter data, and perform calculations on the data.

Interactive Dashboards

The project uses Looker Studio in integration with Google Cloud Console. Looker Studio is used to create interactive dashboards to help Ben monitor business performance. The integration with Google Cloud Console allows for secure and scalable data storage and processing.
Documentation