As a Business Intelligence Analyst, I was tasked with creating an interactive
Power BI dashboard for the Client Success team at DataX. They needed
a tool to track lead returns, examine trends across campaigns and client
blocks, and evaluate performance metrics related to revenue and return rates.
1. Lead Return Dynamics: Analyze and visualize the distribution and
reasons for returned leads across campaigns and client types, with
options to filter by date, block, and campaign ID.
2. Revenue Tracking: Develop a revenue-focused dashboard to assess
revenue by client block and track revenue per Client Success expert.
3. Return Rate Insights: Monitor return rates for specific clients,
allowing the Client Success team to identify high-return companies
for targeted follow-up.
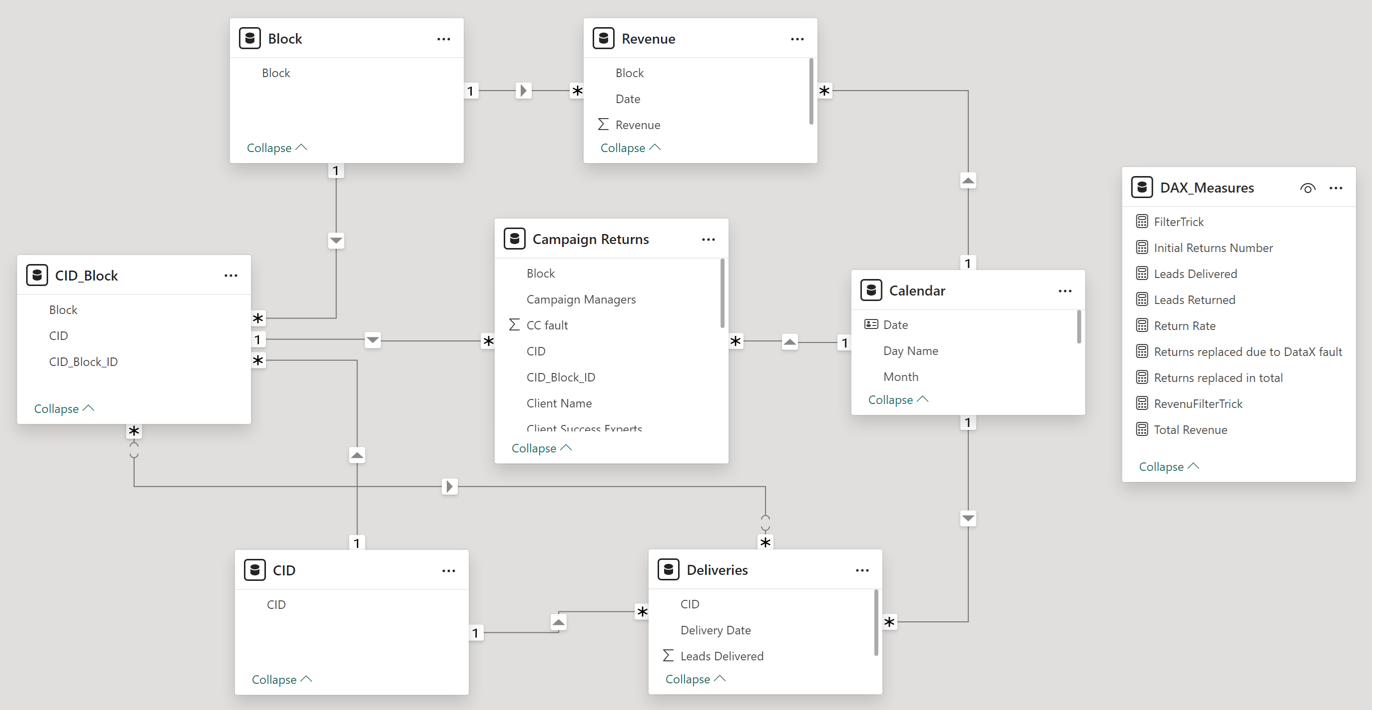
• Data Import: Loaded data from multiple sources, including the “Campaign Returns,”
“Revenue,” and “Deliveries” sheets.
• Data Model Construction: Established relationships among tables,
optimizing the model for multi-dimensional analysis.
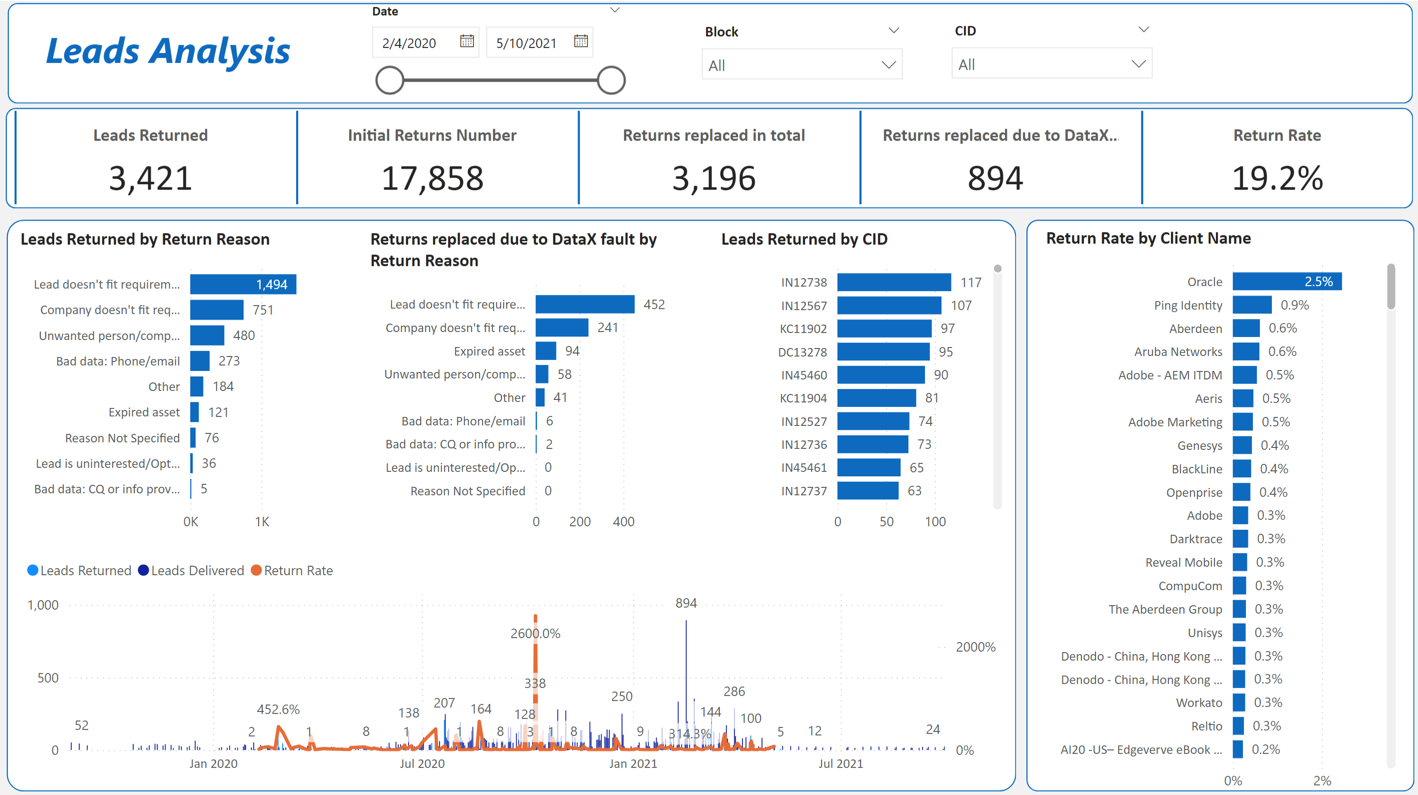
• Lead Return Page: Developed visuals for lead return counts by reason,
campaign ID, and client, with KPI indicators for total leads returned,
initial returns, replaced returns, and return rates. Filters were added for
campaign block, CID, and date to support drill-down analysis.
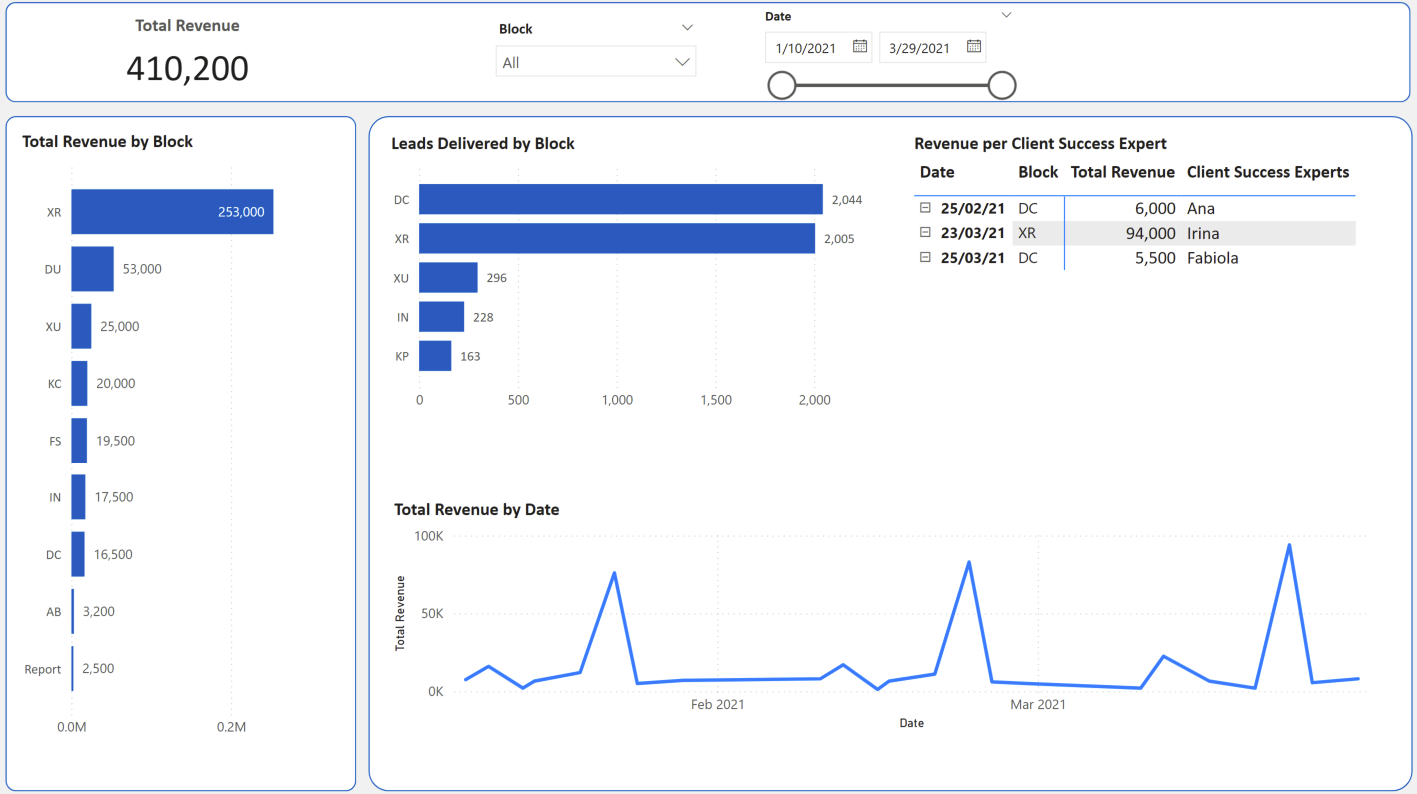
• Revenue Analysis Page: Showcased total revenue by client block and delivery
metrics by block. Included a table displaying revenue per Client
Success expert and a revenue trend line to monitor performance over time.
• Return Rate Visualization: Displayed return rate metrics by client, allowing
the Client Success team to see which clients contribute the highest return rates.
• Created calculated measures for KPIs like return rates, total revenue, and
DataX fault returns using DAX.
• Added slicers, dynamic filters, and KPIs to improve interactivity,
allowing users to explore data by campaign, client, and date range.
1. Lead Returns Overview: The report revealed a high overall return rate of 19.2%, with
the leading reasons being “Lead doesn't fit requirements” and “Company doesn't fit requirements.”
Specific campaigns with these return reasons were flagged for further investigation, helping
the Client Success team address client expectations and refine campaign targeting.
2. Revenue Insights: Revenue distribution was highest in specific blocks,
such as Block XR, and certain Client Success experts contributed
significantly to total revenue. These insights highlighted high-performing
areas and individuals that the team could leverage for best practices in other blocks.
3. Client Return Rate: Notable return rates were identified for specific clients,
such as Oracle with a return rate of 2.5%. These high-return clients were
highlighted for further discussion with Client Success to investigate potential
issues with lead quality or targeting.


